
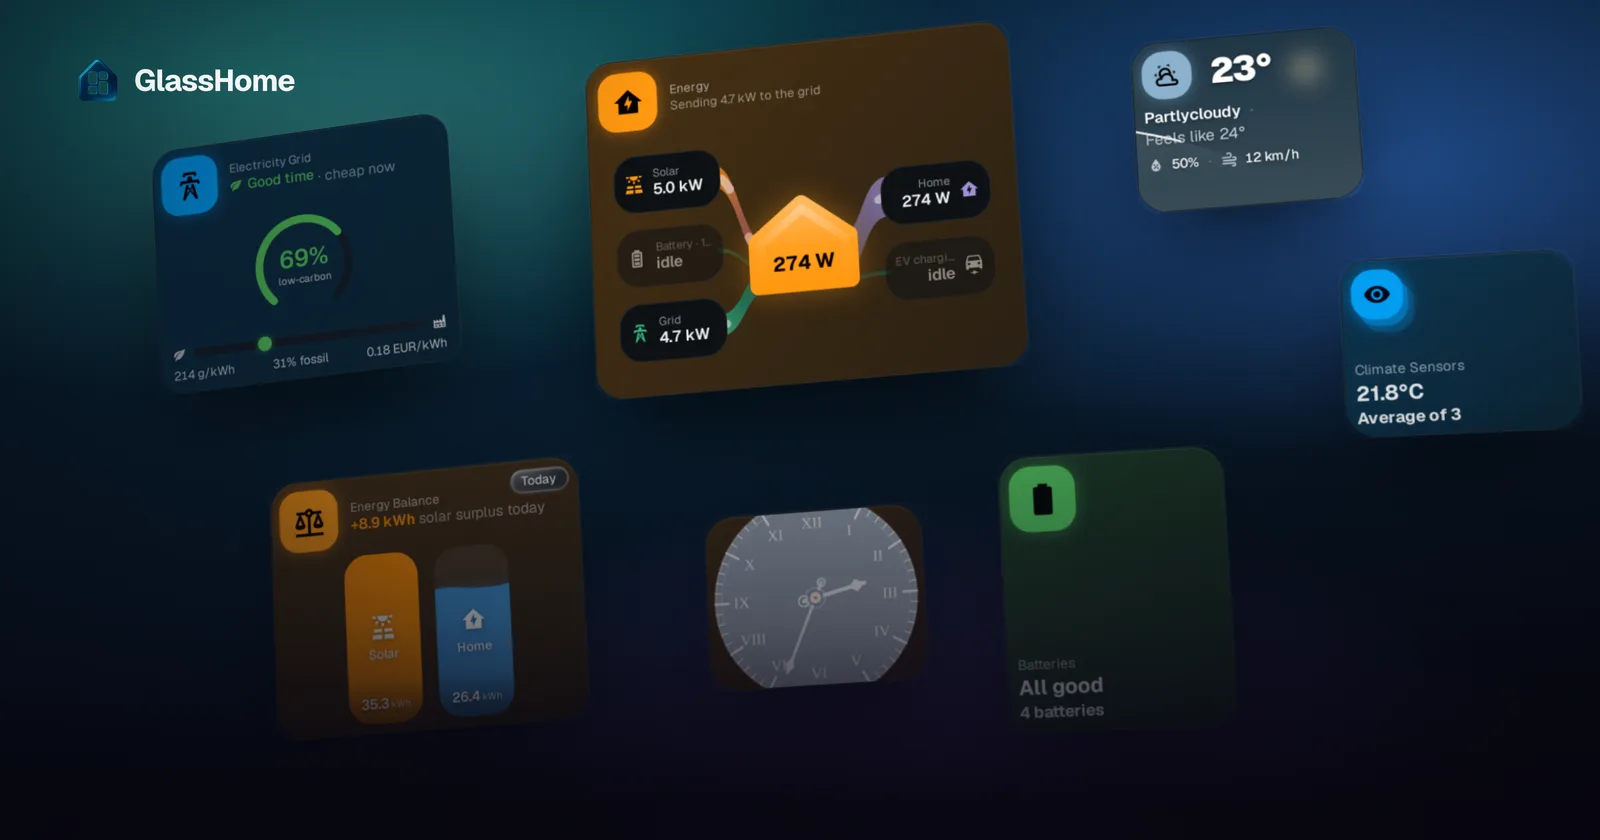
Part 1 built a tile that answers “what is happening now”. This one answers “what has been happening”:
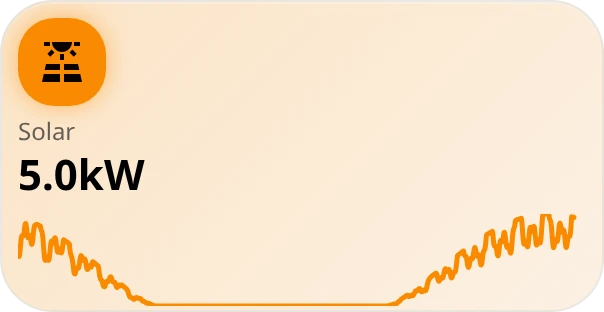
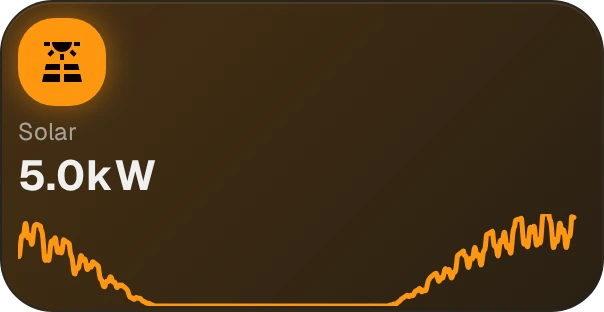
That curve is a real day of solar production, from Home Assistant’s recorder.
Three sources, not one
| You want | Use | Comes from |
|---|---|---|
| The value now | useEntity, useEntities |
Dash’s live store, already in memory |
| The last hours or days | trackEntityHistory + useEntityHistory |
HA’s recorder, fetched on demand |
| Weeks, months, or sums per bucket | useEntityStatistics |
HA’s long-term statistics |
The first is free. The other two are fetches you ask for explicitly. Most widgets want the middle row; reach for statistics when the window would run to thousands of state changes, or when you want HA to do the bucketing.
Step 1: ask for history, then read it
useEntityHistory does not fetch. It reads a slice of Dash’s store that exists only if something asked for it, so track on mount and untrack on cleanup:
import {
  trackEntityHistory,
  untrackEntityHistory,
  useEntityHistory,
} from "@glasshome/widget-sdk";
import { createMemo, onCleanup, onMount } from "solid-js";

const entityId = () => props.config.entityIds[0] ?? "";
const history = useEntityHistory(entityId);

onMount(() => {
  const id = entityId();
  if (id) trackEntityHistory(id, { startTime: new Date(Date.now() - 24 * 3_600_000) });
});
onCleanup(() => {
  const id = entityId();
  if (id) untrackEntityHistory(id);
});

const points = createMemo(() =>
  (history()?.timeline ?? [])
    .map((entry) => ({ value: Number(entry.state), timestamp: entry.timestamp }))
    .filter((p) => !Number.isNaN(p.value)),
);
Skip the onCleanup and the entity stays tracked for the life of the page. history() gives you { timeline, loading, error, lastFetched }. The timeline is state changes, not evenly spaced samples, so plot against the timestamps.
The Number(...) and filter matter: entity states are strings, and a briefly unavailable sensor puts NaN in your series, which turns an SVG path into nothing.
Step 2: turn the series into a line
monotoneCubicPath takes points and returns an SVG path, with no overshoot between samples. Scale your values into the box first:
import { monotoneCubicPath } from "@glasshome/widget-sdk";

const path = createMemo(() => {
  const pts = props.points;
  const w = size().width - 24;
  const h = 46;
  if (pts.length < 2 || w <= 0) return "";

  const values = pts.map((p) => p.value);
  const min = Math.min(...values);
  const max = Math.max(...values);
  const span = max - min || 1;            // a flat series would divide by zero
  const t0 = pts[0]?.timestamp ?? 0;
  const tSpan = (pts[pts.length - 1]?.timestamp ?? t0) - t0 || 1;

  return monotoneCubicPath(
    pts.map((p) => ({
      x: ((p.timestamp - t0) / tSpan) * w,
      y: h - ((p.value - min) / span) * h,
    })),
  );
});<svg class="mt-1 w-full" height="46" aria-hidden="true">
<path d={path()} fill="none" stroke="var(--widget-color)" stroke-width="2.5" stroke-linecap="round" />
</svg>stroke="var(--widget-color)" takes the tile’s tone, so the line matches the widget in both themes without you picking a colour.
Step 3: one component, two sizes
A 1x1 tile has no room for a chart. Measure the shell instead of shipping two widgets:
import { useWidgetDimensions } from "@glasshome/widget-sdk";
const size = useWidgetDimensions();
const roomForChart = () => size().height >= 140 && points().length > 1;<Widget.Value value={Math.round(latest())} unit={unit()} />
<Show when={roomForChart()}>
<Sparkline points={points()} />
</Show>

Same code, same config, different tile. size() is an accessor, so resizing re-decides.
Call it from inside `<Widget>`
useWidgetDimensions throws if you call it in the widget function itself. Put it in a child component that renders inside <Widget>, like PowerContent below.
Longer windows: statistics
For a month of data, ask Home Assistant for pre-bucketed values instead of every state change:
const stats = useEntityStatistics(
() => props.config.entityIds[0] ?? "",
() => ({ startTime: new Date(Date.now() - 30 * 24 * 3_600_000), period: "day" }),
);You get buckets with start, end and the statistics that entity carries. It’s a Solid resource, so stats.loading and stats.error are there, and it re-fetches when the id or options change.
Rule of thumb: sum for metered things (energy, water), mean for sampled ones (temperature, power draw).
The whole widget
// src/my-power/index.tsx
import {
defineConfig,
defineWidget,
field,
type Infer,
monotoneCubicPath,
trackEntityHistory,
untrackEntityHistory,
useEntities,
useEntityHistory,
useWidgetDimensions,
useWidgetEntityGroup,
Widget,
} from "@glasshome/widget-sdk";
import { Icon } from "@iconify-icon/solid";
import { createMemo, onCleanup, onMount, Show } from "solid-js";
const configSchema = defineConfig({
title: field.title(),
entityIds: field.entity("sensor"),
hours: field.number({ title: "Hours of history", default: 24, min: 1, max: 72 }),
});
type Config = Infer<typeof configSchema>;
function Sparkline(props: { points: { value: number; timestamp: number }[] }) {
const size = useWidgetDimensions();
const path = createMemo(() => {
const pts = props.points;
const w = size().width - 24;
const h = 46;
if (pts.length < 2 || w <= 0) return "";
const values = pts.map((p) => p.value);
const min = Math.min(...values);
const max = Math.max(...values);
const span = max - min || 1;
const t0 = pts[0]?.timestamp ?? 0;
const tSpan = (pts[pts.length - 1]?.timestamp ?? t0) - t0 || 1;
return monotoneCubicPath(
pts.map((p) => ({
x: ((p.timestamp - t0) / tSpan) * w,
y: h - ((p.value - min) / span) * h,
})),
);
});
return (
<svg class="mt-1 w-full" height="46" aria-hidden="true">
  <path d={path()} fill="none" stroke="var(--widget-color)" stroke-width="2.5" stroke-linecap="round" />
</svg>
);
}
// Inside <Widget>, so it may measure the shell.
function PowerContent(props: { config: Config; latest: () => number; unit: () => string }) {
const size = useWidgetDimensions();
const entityId = () => props.config.entityIds[0] ?? "";
const history = useEntityHistory(entityId);
onMount(() => {
const id = entityId();
if (id)
trackEntityHistory(id, {
startTime: new Date(Date.now() - props.config.hours * 3_600_000),
});
});
onCleanup(() => {
const id = entityId();
if (id) untrackEntityHistory(id);
});
const points = createMemo(() =>
(history()?.timeline ?? [])
.map((entry) => ({ value: Number(entry.state), timestamp: entry.timestamp }))
.filter((p) => !Number.isNaN(p.value)),
);
const roomForChart = () => size().height >= 140 && points().length > 1;
return (
<Widget.Content>
<Widget.Icon icon={<Icon icon="mdi:solar-power-variant" />} />
<div class="flex min-w-0 flex-col gap-1">
<Widget.Title>{props.config.title || "Power"}</Widget.Title>
<Widget.Value value={Math.round(props.latest())} unit={props.unit()} />
<Show when={roomForChart()}>
<Sparkline points={points()} />
</Show>
</div>
</Widget.Content>
);
}
function MyPowerWidget(props: { config: Config }) {
const entities = useEntities(() => props.config.entityIds);
const { aggregatedData, emptyState, hasEntities } = useWidgetEntityGroup({
entities,
aggregationMode: () => "sensor",
emptyStateConfig: {
icon: <Icon icon="mdi:flash" width={32} />,
title: "No sensor yet",
message: "Hold to pick one",
},
});
const sensor = createMemo(() => {
const data = aggregatedData();
return data && "numericValue" in data ? data : undefined;
});
return (
<Widget variant="classic-glass" tone="accent" emptyState={emptyState()} loading={!hasEntities()}>
<Show when={hasEntities()}>
<PowerContent
config={props.config}
latest={() => sensor()?.numericValue ?? 0}
unit={() => sensor()?.unit ?? ""}
/>
</Show>
</Widget>
);
}
export default defineWidget<Config>({
manifest: {
name: "My Power",
description: "A sensor value with its recent history",
icon: "mdi:solar-power-variant",
minSize: { w: 1, h: 1 },
maxSize: { w: 4, h: 4 },
defaultSize: { w: 2, h: 2 },
sdkVersion: "^1.11.2",
capabilities: [{ domain: "sensor", access: "read" }],
},
configSchema,
component: MyPowerWidget,
});Note the capability: read on sensor, because this widget changes nothing.
A trap when you render previews
The demo home only has history for its energy entities, so point your examples at sensor.solar_power or sensor.home_power. Anything else renders a tile with no line.